Keep track of test suite run duration with Travis CI
I wanted to view how the test suite run duration has been changing over time on a few projects. The tests are run using the pro version of Travis CI. Travis CI is a hosted continuous integration platform which provides easy to configure way to get a continuous integration server for your projects. Luckily Travis also has an API that exposes the test build information.
So why should you be interested about test duration?
Test duration is important because if running your tests takes too much time it builds friction and you run the tests less often. When you don’t run your tests regressions get committed to version control which slows down your other team members. Also if you do test-driven development (TDD) the feedback loop provided by the tests gets too slow to be useful.
If you do the test suite duration comparison often enough you can pinpoint tests that slow the suite down disproportionately to the benefit the added test provides. When you know certain test is especially slow you can think of ways to improving the speed of the test or find a way to test the functionality with another, faster way.
Pulling test suite durations from Travis
Fetching Travis data is easy using Ruby and the official Travis Ruby library. These instructions are for the pro version of Travis which is meant for private repositories. You can also use the same instructions for the open source version of Travis but you need to change the commands and library usage to remove the references to pro.
First install the Travis RubyGem:
gem install travis
Then login to Travis using it:
travis login --pro --auto
Here is the Ruby file for fetching the data:
require 'travis/pro/auto_login'

repo_name = "your-organization/your-project"

builds = Travis::Pro.repos.find(repo_name).first.builds
finished_builds = builds.select(&:finished?)
durations = finished_builds.map {|build|
  [build.started_at, build.duration, build.commit.sha]
}
File.open("stats.txt", "w") {|f|
  durations.each do |duration|
    f.puts duration.join("\t")
  end
}
The program fetches all finished builds for a repository, gets the durations and writes those to a file stats.txt separated by tabs.
To make the data a bit more readable for large projects, lets skip some data points to get to less than 100:
require 'travis/pro/auto_login'

repo_name = "your-organization/your-project"

builds = Travis::Pro.repos.find(repo_name).first.builds

finished_builds = builds.select(&:finished?)
every_n_build = (finished_builds.size / 100.to_f).ceil

smaller_dataset = finished_builds.each_slice(every_n_build).map(&:first)
durations = smaller_dataset.map {|build|
  [build.started_at, build.duration, build.commit.sha]
}

File.open("stats.txt", "w") {|f|
  durations.each do |duration|
    f.puts duration.join("\t")
  end
}
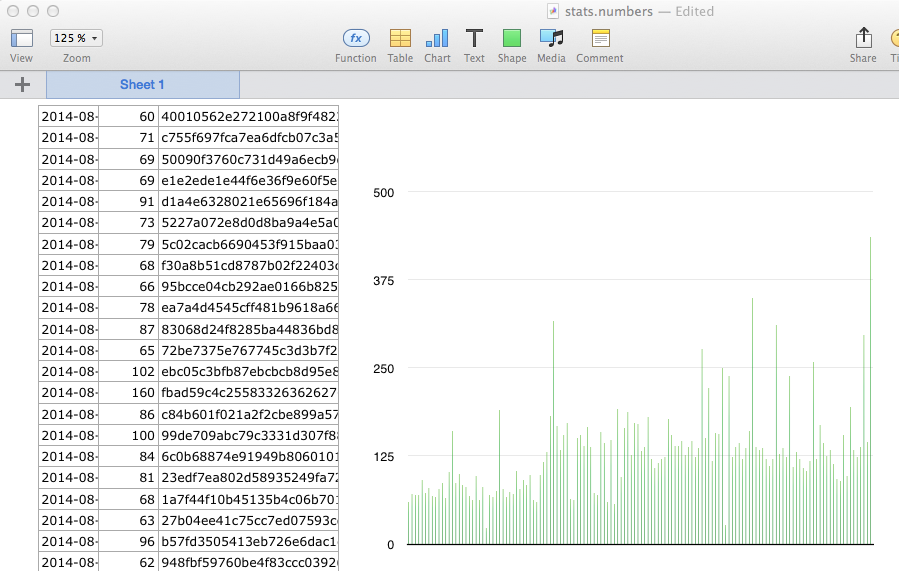
Now you can use your favorite charting tool to get something visual.
Here is a screenshot of a data from one of my apps created using Numbers.app. It was created by opening the file in Numbers.app, selecting the data and selecting bar chart from the Chart menu.